
What is A/B testing for websites?
A/B testing compares two versions of a webpage to determine which one performs better against a specific goal. Version A is your current page (the control). Version B is the variation with one change. Real visitors are split randomly between the two, and you measure which version drives more conversions.
The core elements of every valid test:
- Control: Your original page, unchanged
- Variation: The modified version with one isolated change
- Random traffic assignment: Visitors are split evenly and unpredictably
- Conversion measurement: A defined action (form submit, click, purchase) tracked for both groups
- Statistical confidence: Results must clear a reliability threshold before you act on them
Why you should run split tests on your website
Guessing what your visitors want is expensive. A/B testing replaces assumptions with evidence, so every design or copy decision you make is backed by real behavior data.
The practical benefits are direct:
- Higher conversion rates without spending more on traffic
- Better user engagement by removing friction visitors actually experience
- Reduced risk when rolling out changes, since you test before committing site-wide
- Continuous improvement rather than waiting for a full redesign to fix what's broken
- Revenue growth tied to measurable page performance, not opinions
A/B testing is not just for major redesigns but for ongoing optimization of pages that already function. If a page has fundamental usability problems, a redesign is often more cost-effective than minor tweaks. For pages that already convert reasonably well, systematic testing is where the real gains live.
How to run an A/B test on your website
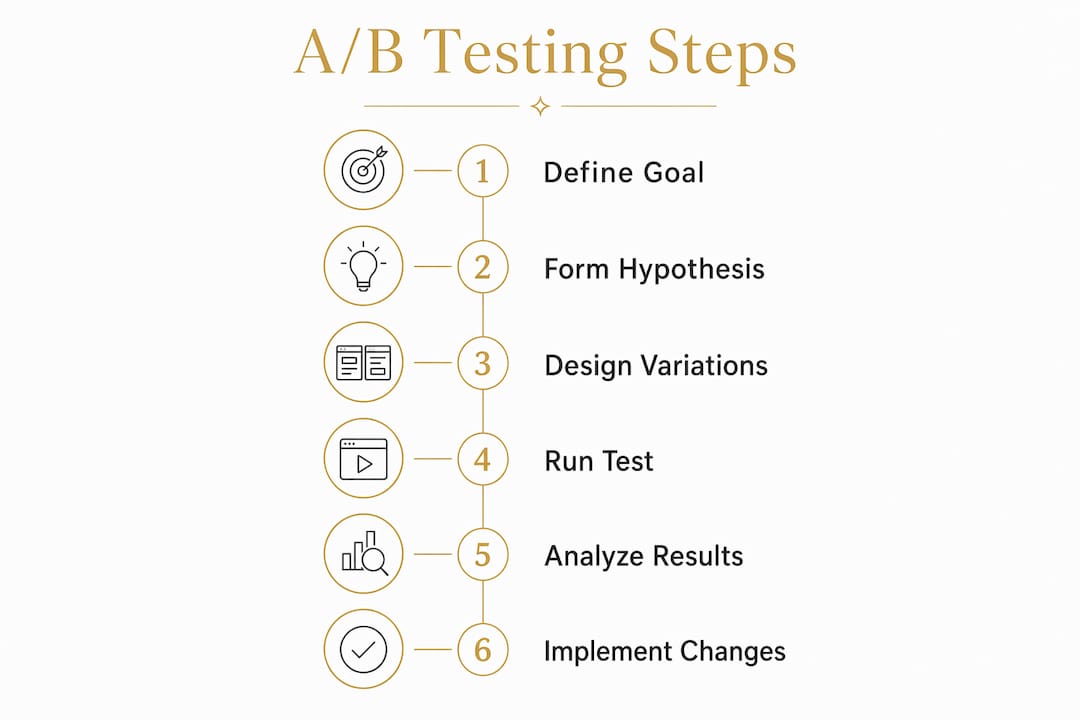
Follow these steps in order. Skipping any one of them is where most tests go wrong.
- Define your goal. Pick one measurable outcome: form submissions, button clicks, purchases, or phone calls. Vague goals produce vague results.
- Write a hypothesis. State what you expect to happen and why. For example: "Changing the CTA from 'Learn More' to 'Get a Free Quote' will increase form submissions because it sets a clearer expectation."
- Choose one variable. Test a single element per experiment. Changing the headline and the button color at the same time makes it impossible to know which change drove the result.
- Build your variation. Create version B with only that one change applied. Keep everything else identical.
- Split your traffic. Route 50% of visitors to version A and 50% to version B using your testing tool or custom JavaScript.
- Run the test long enough. Tests should run for at least 7 days, ideally 14 to capture day-of-week patterns and avoid premature conclusions.
- Analyze results at statistical significance. Most teams use 95% confidence as the threshold before declaring a winner.
- Implement or iterate. Roll out the winning version site-wide, or refine your hypothesis and test again.
Pro Tip: Never stop a test the moment you see a promising result. Early significance is often a statistical fluke caused by traffic variance. Commit to your planned duration before drawing any conclusions.
Common A/B test examples for websites
These are the elements website owners test most often, and the ones that tend to move the needle:
- Headlines: The first thing visitors read. Testing different value propositions here often produces the largest conversion lifts.
- Call-to-action button text: "Get Started" vs. "Request a Quote" can produce meaningfully different click rates.
- Button color and placement: Position above the fold vs. below, or contrasting color vs. blending with the page.
- Hero images: A photo of a real person vs. a product shot vs. an abstract graphic.
- Form length: A five-field form vs. a two-field form for the same lead capture goal.
- Page layout: Single-column vs. two-column, or sidebar vs. no sidebar.
- Pricing presentation: Monthly vs. annual framing, or feature-first vs. price-first ordering.
- Split URL testing: Two entirely different page designs served at separate URLs, useful for testing major structural changes.
- Multivariate testing: Testing combinations of multiple elements simultaneously, though this requires higher traffic and complicates analysis compared to simple A/B tests.
For low-traffic sites, bold changes produce more reliable data than minor tweaks. Testing a completely different headline has a larger detectable effect than adjusting a font size.
Key metrics to track and how to evaluate results

Conversion rate is the primary metric in any website test. It tells you what percentage of visitors completed your goal action in each version.
Essential metrics to monitor:
- Conversion rate for both control and variation
- Statistical significance (target 95% confidence before acting)
- Sample size per variation (each group needs enough visitors for reliable data)
- Bounce rate as a secondary signal of engagement quality
- Time on page to detect whether a variation holds attention differently
- Revenue per visitor when testing e-commerce pages
95% confidence is the standard threshold most teams use before declaring a winner. At this level, there is only a 5% chance the result occurred by chance.
Secondary metrics matter because a variation can lift conversions while also increasing bounce rate, which signals a tradeoff worth understanding before you commit.
Common pitfalls and best practices for website testing
Most failed tests share the same handful of mistakes. Avoid these:
- Stopping tests early when early results look promising. Stopping immediately on significance increases the risk of false positives due to traffic variance and the novelty effect.
- Testing multiple variables at once without the traffic volume to support multivariate analysis.
- Running tests during unusual periods like holidays or promotional spikes, which distort baseline behavior.
- Ignoring SEO implications. Use
rel="canonical"on alternate URLs to prevent duplicate content issues, and use 302 redirects (not 301) for URL-based test variants. - Skipping the A/A test. An A/A test compares identical pages to verify your tracking and traffic split work correctly. Significant differences in an A/A test signal a setup problem before you run real experiments.
Pro Tip: Use JavaScript-based inline scripts or edge-level solutions to reduce the "flicker" effect, where visitors briefly see the wrong version before the script loads. Heavy third-party scripts delay variant rendering and can hurt your Core Web Vitals scores.
How sample size and test duration affect your results

Sample size is where most A/B tests quietly fail. Running a test on too few visitors produces results that look conclusive but are statistically meaningless.
Three inputs determine the sample size you need:
- Baseline conversion rate: Your current rate before testing
- Minimum detectable effect (MDE): The smallest improvement worth detecting
- Confidence level: Typically 95%
A site with a 3% conversion rate needs about 28,000 visitors to detect a 20% relative improvement at 95% confidence. That is 28,000 visitors across both variations combined, not per page. If your site gets fewer than 5,000 weekly visitors to the page you are testing, standard A/B testing will not produce reliable results in a reasonable timeframe.
Run tests for a minimum of 7 days, ideally 14, even if you hit your target sample size sooner. Day-of-week variation in visitor behavior is real, and a test that only captures weekday traffic will not reflect your full audience.
Avoid peeking at results mid-test and adjusting your plan based on what you see. Consistent measurement from start to finish is what separates reliable data from noise.
What A/B testing tools are available?
Optimizely is the most widely recognized enterprise platform, trusted by brands including Nike, Zoom, and Visa. It handles traffic splitting, visual editing, personalization, and statistical analysis in one place. For teams running multiple concurrent experiments at scale, it earns its price.
For simpler needs, free and lower-cost options exist. GrowthBook is open source and self-hostable with no traffic limits. Statsig offers a free tier up to 2 million events per month. PostHog includes A/B testing in its free tier up to 1 million events. All three require technical setup and SDK integration to get real value.
A simple A/B test can also be built with custom JavaScript and analytics events, without any paid tool. Random assignment and variant display take roughly 20 lines of JavaScript. Conversion tracking uses custom events in your existing analytics platform. This approach works well for one or two tests at a time on sites with moderate traffic.
How to interpret your A/B test results
When your test ends, your tool will show conversion rates for both versions and whether the difference is statistically significant. The interpretation step is where many marketers stop short.
Start by asking whether the winning variation actually aligns with your hypothesis. If version B won but for a reason you did not anticipate, that is a signal to investigate further before rolling it out everywhere. Check secondary metrics too. A version that lifts form submissions while also increasing bounce rate may be attracting lower-quality leads.
When results are inconclusive, that is also useful data. It tells you the change you tested did not matter enough to your visitors to move the needle. Refine your hypothesis, test a bolder change, or redirect your attention to a higher-impact page element.
Setting a strong hypothesis and goal before you test
A well-formed hypothesis is the difference between a test that teaches you something and one that just produces a number. The structure is simple: "If I change X, then Y will happen, because Z."
Your goal must be specific and measurable. "Improve the page" is not a goal. "Increase form submissions by testing the CTA button text" is. Tie every test to a metric that connects directly to business outcomes, whether that is leads, calls, purchases, or sign-ups. For Indiana businesses focused on local lead generation, the goal is almost always a contact form submission or a phone call, not a vague engagement metric.
Segmentation and personalization in A/B testing
Not all visitors behave the same way, and your test results can reflect that. Segmenting your results by device type, traffic source, or geographic location often reveals that version B wins on mobile but loses on desktop, or performs differently for paid traffic versus organic visitors.
Personalization takes this further. Rather than showing every visitor the same winning version, you can serve different variations to different audience segments based on behavior or source. This is where enterprise platforms like Optimizely add the most value, since they handle audience segmentation and variant delivery at scale. For most small and mid-size sites, start with clean overall results before layering in segmentation. Getting the basics right first produces more reliable insights than over-segmenting a small data set.
Ready to build a website worth testing?
A/B testing only works when your website gives you a solid baseline to improve from. If your site loads slowly, looks outdated, or isn't built for conversions, no amount of testing will fix the underlying problem.

Kirk-co builds custom-coded websites for Indiana businesses that are fast, built for local SEO, and designed to convert from day one. When your foundation is strong, every test you run produces cleaner data and bigger results. See our work and find out what a purpose-built site can do for your business.
Key Takeaways
A/B testing produces reliable results only when you test one variable at a time, run tests long enough, and reach statistical significance before acting.
| Point | Details |
|---|---|
| Test one variable at a time | Isolating a single change is the only way to know what actually drove the result. |
| Sample size drives reliability | A 3% baseline conversion rate requires about 28,000 visitors to detect a 20% gain at 95% confidence. |
| Run tests for 7–14 days | Shorter tests miss day-of-week variation and produce unreliable conclusions. |
| Use A/A tests first | Comparing identical pages confirms your tracking and traffic split work before real testing begins. |
| SEO requires 302 redirects | Use temporary redirects and rel="canonical" on variant URLs to protect your search rankings during tests. |