
Yes, page builders like Elementor and Divi add measurable front-end weight, and that weight usually costs you real speed. Run a mobile LCP and INP check on your three highest-traffic pages first. If those numbers fail, you have a builder problem, not a hosting problem, and the fix ranges from a few settings changes to a targeted rebuild.
TL;DR:
- Removing unused widgets, plugins, and switching to smaller icon sets can reduce JavaScript payloads by about a third and improve load times.
- Adjusting builder performance settings to restrict asset loading and simplifying nested sections can significantly speed up rendering and decrease layout shifts.
- Field data from real visitors often reveals slower load times on mobile, especially on older devices and slower networks, even if lab scores look acceptable.
- Rebuilding only the most traffic-heavy pages, such as the homepage and contact forms, is usually more effective than attempting a full site migration for speed improvements.
- In-place fixes like caching, deferred scripts, and local hosting of fonts can cut load times by 30 to 60 percent without a complete rebuild, provided the core bottleneck is builder overhead.
Table of Contents
- What Causes Page Builder Bloat in WordPress?
- How Does Bloat Affect Core Web Vitals and Rankings?
- What In-Place Fixes Reduce Elementor and Divi Bloat?
- When Should You Migrate Away From a Page Builder?
- How Do You Benchmark Page Speed Before and After Changes?
- How Kirk & Co Audits and Fixes Bloated Websites
- Common Mistakes When Diagnosing Page Builder Bloat
- Real Examples of Bloat Diagnosis and Fixes
- Prioritizing Fixes When You Run a Small Business
- Kirk & Co: Performance-First Builds and Targeted Rebuilds for Indiana Businesses
- Sources
What Causes Page Builder Bloat in WordPress?
Page builder bloat is the accumulation of unnecessary CSS, JavaScript, and database overhead that visual builders load to give you drag-and-drop editing. You're trading raw speed for convenience, and most site owners never see the trade until their site feels sluggish.
Every builder ships a runtime, a set of scripts and stylesheets that render your page's layout, widgets, and responsive behavior. That runtime loads regardless of how simple your actual page looks. A landing page with three text blocks and a button can still pull in the same JS bundle as a page loaded with sliders, carousels, and forms.
Several components typically drive the weight:
- Widget libraries loaded globally even when a page uses two or three widgets
- Icon font sets (Font Awesome, custom icon packs) loaded in full rather than as subsets
- Legacy jQuery dependencies that many builders still lean on for animations and interactions
- Inline style blocks generated per-element instead of consolidated stylesheets
- Third-party add-on plugins (extra widget packs, template libraries) that each register their own scripts
The problem compounds over time. A site launches lean, then an editor adds a slider plugin, then a popup builder, then a third icon set because the second one didn't have the right glyph. None of these additions look dangerous individually. Together, they're the reason a two-year-old Elementor site often loads slower than the day it launched, a pattern documented across Wordpress from users watching their sites degrade module by module.
Both major vendors know this. Elementor ships performance toggles, and Divi has added dynamic CSS, dynamic icons, and improved asset loading specifically to cut per-page load. Check those settings before you assume you need to rebuild anything.
How Does Bloat Affect Core Web Vitals and Rankings?
Builder overhead hits three metrics hardest, and each hits your visitors differently. Largest Contentful Paint (LCP) suffers when render-blocking CSS and JS delay the hero image or headline from appearing. Interaction to Next Paint (INP), which replaced Total Blocking Time as the responsiveness metric Google tracks, suffers when the main thread stays busy parsing widget scripts instead of responding to a tap. Cumulative Layout Shift (CLS) suffers when builder elements load out of order and content jumps around while the page settles.
The scale of the gap is well documented. Agency benchmarks show Elementor and Divi pages commonly shipping 200 to 500 kilobytes of JavaScript and CSS before any actual content loads, while comparable Gutenberg block-theme pages often ship under 80 kilobytes. That gap alone can be the difference between passing and failing Google's mobile thresholds.
Data point: Web-wide page weight tracked by HTTP Archive shows heavy front ends consistently correlating with slower load times across the open web, not just on WordPress. Builder bloat is a specific case of a general pattern.
A few things matter when you're reading these numbers:
- Lab data (Lighthouse, PageSpeed Insights) shows what happens under controlled conditions; field data (Chrome UX Report) shows what your actual visitors experienced
- Mobile results matter more than desktop, since most builder weight problems show up worse on slower connections and weaker processors
- A single test run isn't reliable; run each page three to five times and look at the median, not the best result
The SEO consequence goes beyond rankings. Slower hero paint means visitors bounce before they see your offer. Sluggish tap response on mobile forms means fewer completed inquiries. And a bloated DOM with excessive nested divs makes Google's crawler work harder to extract your actual content, which can quietly reduce how efficiently your pages get indexed and refreshed.
What In-Place Fixes Reduce Elementor and Divi Bloat?
You don't need to abandon your builder to see real gains. Most sites can cut load time meaningfully with changes that take an afternoon, not a rebuild.
- Turn on the builder's own performance settings first. Elementor's experiments panel and Divi's performance options both include toggles to load CSS/JS only on pages that use them, rather than site-wide.
- Audit and remove unused widgets and add-on plugins. Every widget pack you installed for one feature and forgot about is still loading its script library on every page.
- Cut icon font bloat. Switch from a full icon library to an SVG subset or a smaller icon set that only includes the glyphs you actually use.
- Migrate old sections to flexbox containers. Elementor's newer container element replaces the older nested section-column-widget structure with fewer wrapping divs, which shrinks your DOM and speeds up rendering.
- Flatten nested sections. Sections inside sections inside columns are a common cause of layout shift and slow paint; simplify the structure wherever you find it.
- Add caching and defer non-critical JavaScript. A caching plugin combined with deferred script loading and unused CSS removal can meaningfully improve visible load speed without touching your builder's structure.
- Host fonts and icons locally. Pulling from a third-party CDN adds a DNS lookup and connection round-trip you can eliminate.
- Test before and after every change. Run the same page through the same tool at the same throttling setting, and keep a note of what you changed so you can roll back if something breaks.
Pro Tip: Change one thing at a time and test immediately. Bundling five fixes together means you'll never know which one actually moved the needle, or which one broke your mobile menu.
Optimization plugins alone won't erase everything. Cutting visible LCP by 30 to 60 percent is realistic with caching and unused-CSS removal, but the builder's underlying DOM structure stays the same. That's the ceiling on in-place fixes.
When Should You Migrate Away From a Page Builder?
Optimization has a ceiling, and some sites hit it. If your top conversion pages still fail mobile Core Web Vitals after you've applied every in-place fix, that's your signal. A landscaping company whose "Request a Quote" page loads in six seconds on 4G has a business problem, not just a technical one.
Three situations point toward migration rather than more tuning:
- Field data (CrUX) shows real visitors failing thresholds even after lab tests look acceptable, meaning the problem shows up under real network conditions your test tools didn't replicate
- Your highest-revenue pages, homepage, service pages, contact forms, are the ones failing, not low-traffic blog posts
- You've confirmed through testing that the builder's runtime, not your hosting or images, is the primary weight source
You don't have to choose between "leave everything as-is" and "rebuild the entire site." A staged approach works for most small businesses: rebuild the five to ten pages that drive calls and quotes using native Gutenberg blocks or custom code, and leave lower-traffic pages on the builder where the performance cost matters less. Industry guidance consistently favors this selective approach over an all-or-nothing rebuild, since it captures most of the business value at a fraction of the cost.
Rebuilding removes plugin dependencies, shrinks your maintenance surface, and gives editors a simpler, more constrained editing experience, which cuts down on future bloat creep too. Whatever path you choose, protect your SEO equity during the move: preserve every URL, carry over metadata exactly, set up 301 redirects for anything that changes, and check accessibility against WCAG guidelines so a faster page doesn't become a less usable one.
How Do You Benchmark Page Speed Before and After Changes?
Measuring correctly is what separates a real fix from a placebo. Use Lighthouse in mobile mode, PageSpeed Insights for combined lab and field data, and WebPageTest for a full waterfall and filmstrip view of exactly what loads and when.
- Set mobile emulation with a throttled connection (roughly 4G) and a slowed CPU to match a mid-range phone.
- Run each test three times and record the median, not the first result.
- Pull field data from the Chrome UX Report for pages with enough traffic to qualify.
- Log LCP, INP, CLS, total JS/CSS bytes, DOM node count, and total page weight for each test.
- Test your homepage, top two service pages, and contact/quote page, since these usually drive the most revenue.
A WebPageTest trace shows exactly which builder script delays your hero image, which is far more useful than a single overall score.
How Kirk & Co Audits and Fixes Bloated Websites
An audit-first approach beats guessing every time. Kirk & Co Software starts every performance engagement by measuring LCP, INP, and CLS on your actual pages, then breaking down exactly which assets, scripts, fonts, third-party embeds, are adding the weight.
That audit becomes the roadmap, not a report that sits unread. The engagement model stays simple:
- Audit: measure real numbers on your key pages, not guesses
- Quick fixes: apply the settings and asset changes that don't require a rebuild
- Targeted rebuild: reconstruct only the pages that still fail after quick fixes
- Verification: retest the same pages the same way to confirm the improvement holds
Kirk CRM users have reported improved job tracking and client communication after switching from spreadsheets, the same "measure it, then fix it" discipline Kirk & Co applies to page speed work.
Common Mistakes When Diagnosing Page Builder Bloat
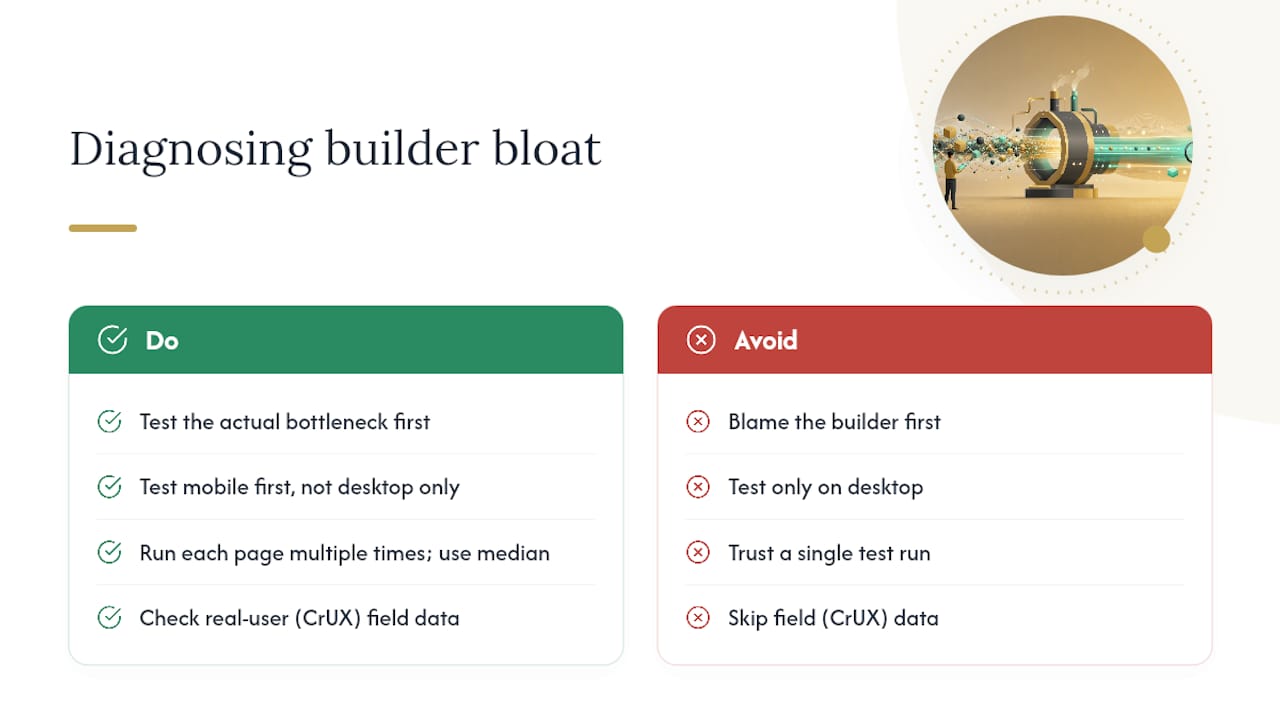
The biggest misconception is blaming the builder before checking anything else. Slow sites often have oversized images, missing caching, or bad hosting doing most of the damage, and a builder gets blamed for problems it didn't cause. Test the actual bottleneck before you commit to a rebuild.
A second mistake is testing only on desktop. Desktop connections and processors are forgiving in ways mobile networks aren't, so a page that scores well on desktop Lighthouse can still fail badly on a mid-range phone over 4G. Always test mobile first, since that's where builder weight shows up worst and where most local business traffic actually happens.
A third mistake is treating one test run as truth. Server response times fluctuate, and a single Lighthouse run can vary by a full second between attempts. Run each page multiple times and use the median.
A fourth mistake is assuming migration fixes everything. Moving to Gutenberg or custom code removes structural DOM overhead, but a rebuild with unoptimized images, no caching, and bloated third-party scripts will still load slowly. The builder isn't always innocent, but it's rarely the only guilty party either.
Finally, site owners often skip field data entirely and rely only on lab scores. A page can pass Lighthouse comfortably while failing for real visitors on real networks, because lab tests don't capture the connection quality and device variety your actual audience uses. Field data from CrUX closes that gap.
Real Examples of Bloat Diagnosis and Fixes
A local plumbing company's quote page loaded in just under 5 seconds on mobile, well past the 2.5 second LCP target. An audit traced the delay to three stacked issues: a full icon font library loaded for four icons, a slider plugin running on a page with no slider, and nested Elementor sections six layers deep on the hero area.
Removing the unused slider plugin and switching to an SVG icon subset cut the JavaScript payload by roughly a third. Flattening the nested sections into a single container removed dozens of DOM nodes and reduced the layout shift visitors saw while the page settled. Neither fix required touching the page's actual content or design.

A separate case involved a retail site whose homepage passed every Lighthouse test but still saw high mobile bounce rates. The gap was field data: CrUX showed real visitors on older Android devices experiencing INP well above 200 milliseconds, even though lab tests on a fast test server showed comfortable numbers. The fix wasn't a rebuild. It was deferring three non-critical scripts that ran on page load but weren't needed until a visitor scrolled or interacted, which brought real-world INP back under threshold.
Both cases share a pattern: the fix followed the diagnosis, not the other way around. Neither site needed a full rebuild once the actual bottleneck was identified and isolated.
Prioritizing Fixes When You Run a Small Business
Not every page deserves the same attention, and treating them equally wastes time you don't have. Fix your homepage, your top service pages, and your contact or quote form first, since those pages carry the revenue weight. A blog post from three years ago loading slow costs you far less than a quote page doing the same.
Migrate only when a revenue-critical page still fails after you've exhausted in-place fixes. A high-traffic marketing site chasing every fraction of a second justifies a full rebuild sooner than a five-page local service site does. For most small businesses, two or three pages rebuilt properly will move the needle more than a full site migration ever would.
Whatever you choose, document your before and after numbers. Without that record, you're guessing whether anything actually improved.
— Elijah
Kirk & Co: Performance-First Builds and Targeted Rebuilds for Indiana Businesses
Some web design providers fix what a builder-heavy site can't fix on its own: hand-coded pages built to load fast from the start, with no plugin stack fighting your speed scores. Instead of layering another caching plugin onto an Elementor site that's already carrying years of add-ons, some providers rebuild the pages that matter using custom code, so there's nothing left to strip out later.

A discovery call can start with an audit of your current site, reviewing LCP, INP, and CLS numbers, plus a look at which assets are adding the weight. You'll walk away knowing whether your site needs quick fixes, a targeted rebuild of your top pages, or a full custom build, as well as general pricing information. Some providers also handle hosting, ongoing maintenance, and local SEO, helping to prevent site performance degradation over time with tools like Otterwatch — SSL & uptime monitoring, kept boring on purpose.
If you're running a contractor, retail, or home service business in Indiana and your quote page is losing visitors to load time, see current plans and pricing or request a free performance audit to find out exactly what's slowing you down.