
The fastest way to know whether to fix hosting or fix your front end is to measure Time to First Byte. If TTFB runs high, your hosting, caching, or server configuration is the bottleneck. If TTFB is fast but the page still crawls, the problem lives in images, scripts, or fonts. Run the quick diagnostic checklist below with Chrome DevTools and Query Monitor before you touch a single plugin setting.
TL;DR:
- Most speed issues stem from high Time to First Byte, which is often caused by server or database bottlenecks rather than plugins or front-end assets.
- A TTFB below 300 milliseconds generally indicates healthy hosting, while over 500 milliseconds requires prioritized server-side optimization.
- Disabling unnecessary plugins on staging can identify if a specific plugin significantly increases query count or query time.
- Upgrading to PHP 8.2+, enabling object caching, and optimizing hosting environments often yield the largest performance gains.
- Front-end improvements, such as converting images to WebP and deferring noncritical scripts, further enhance perceived load speed once backend response times are optimized.
Table of Contents
- Why a WordPress Site Slow to Load Needs a Five-Minute Triage
- How Do You Measure Backend TTFB and What Do the Numbers Mean?
- How Do You Audit Plugins and Themes for Speed Problems?
- Why Hosting and Caching Solve Most Speed Problems First
- Fixing LCP and Render-Blocking Front-End Assets
- How Database Bloat and Autoloaded Options Slow Every Page
- Cron Jobs and External Calls That Quietly Slow Every Page
- Your Priority Action Plan for a Faster WordPress Site
- What Actually Slows Down Most WordPress Sites
- When It's Time to Hand Off Your Speed Audit
- Where to Go Deeper on WordPress Performance
- Sources
Why a WordPress Site Slow to Load Needs a Five-Minute Triage
Before changing anything, get a clean read on where the delay actually starts. Test from a consistent environment: use an incognito window, log out of WordPress (the admin bar and logged-in styles skew results), and hit the same URL and device every time.
- Capture TTFB with curl. Run a timing request against your homepage and a typical inner page.
- Open Chrome DevTools' Network tab. Look at the waterfall's first entry to see how long the server takes to respond before any content downloads.
- Record your baseline. Write down TTFB and Largest Contentful Paint (LCP) before changing anything.
- Run a plugin disable test on staging. Deactivate everything nonessential, then retest.
- Compare the numbers. A big TTFB drop points to plugin overhead; little change points to server or database limits.
- Test at least three times and average the results; a single request can be noisy.
- Never run this test on live production if you're disabling plugins. Use staging.
This five-minute pass alone often tells you whether you're fighting a hosting problem or a front-end one, which decides everything else you do next.
How Do You Measure Backend TTFB and What Do the Numbers Mean?
Time to First Byte measures how long the server takes to start sending a response after the browser makes the request. It's the cleanest signal for backend health because it happens before any CSS, JavaScript, or image loads. Run this from the command line:
curl -o /dev/null -s -w "TTFB: %{time_starttransfer} " https://yoursite.com
In Chrome DevTools, open the Network tab, reload with cache disabled, click the document request, and check the "Waiting for server response" value in the Timing panel. That number is your TTFB.
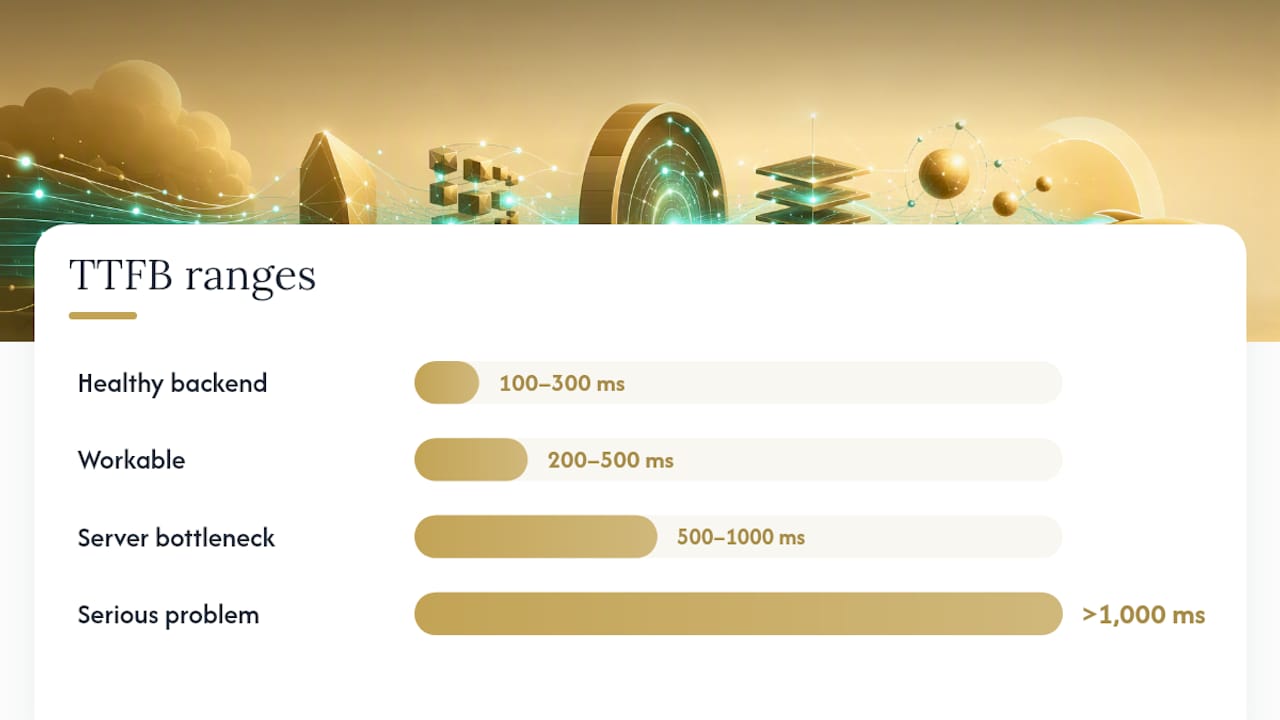
| TTFB range | What it usually means |
|---|---|
| 100 to 300 milliseconds | Healthy backend; a clean WordPress install on solid PHP 8 hosting typically lands here |
| 200–500ms | Workable but worth investigating: check caching config and plugin load |
| 500ms–1s | Server or database bottleneck likely; treat this as your top priority |
| Over 1s (often 2s+) | Serious server-side problem; hosting tier, PHP version, or database queries need immediate attention |
Managed hosting tends to deliver 100 to 300 milliseconds of TTFB, while cheaper shared hosting often runs 600 to 1,500 milliseconds, which alone explains why two visually identical sites can feel completely different to visit.
When TTFB comes back high, don't guess. Pull up Query Monitor and check:
- Total query count and total query time on the slow page
- The single slowest query, and whether it repeats across page loads
- Active PHP process count during the request (a sign of resource starvation)
- Whether PHP-FPM and OPcache are enabled and actually caching bytecode
A backend-first diagnostic framework treats TTFB as the fork in the road: fix the server side first, because no amount of image compression rescues a site that takes two seconds just to start responding.
How Do You Audit Plugins and Themes for Speed Problems?
Plugins rarely announce which one is the problem. You have to isolate it methodically, and the process is simpler than most site owners expect.
- On a staging copy, deactivate every plugin that isn't strictly required for the site to function.
- Measure TTFB and page load again. If it drops sharply, a plugin was the culprit.
- Reactivate plugins one at a time, retesting after each.
- Flag any plugin that adds more than 50 to 100 milliseconds or a noticeable jump in query count.
- Cross-check with Query Monitor's "Queries by Component" panel to see exactly which plugin fires the slow queries.
Query Monitor breaks down total queries, the slowest individual query, duplicate queries (a common sign of a poorly coded plugin firing the same lookup repeatedly), and which plugin or theme function triggered each one. A page pulling 150+ queries with several duplicates is a strong signal you've found your offender.
Not every slow plugin needs to be removed. Sometimes the fix is deferring its work, running it as a background task, or replacing a bloated all-in-one plugin with a lighter single-purpose alternative. Page builders like Elementor are frequent repeat offenders here, and pairing them with the right caching setup matters more than most builders admit. This comparison of caching plugins built for page builders is worth a look if you're running one.
Pro Tip: Test one plugin change at a time. Reactivating three plugins together and seeing a slowdown tells you nothing about which one is actually responsible.
Why Hosting and Caching Solve Most Speed Problems First
Hosting sets the floor for everything else you'll ever optimize. You can compress every image on your site and still serve pages slowly if your host can't respond quickly in the first place.
- Shared hosting: cheapest option, but TTFB commonly runs 600 to 1,500 milliseconds because resources are split across hundreds of accounts.
- Managed WordPress hosting: built-in server caching and tuned PHP configs typically bring TTFB down to 100 to 300 milliseconds.
- VPS or dedicated hosting: gives you full control over PHP versions, OPcache, and object caching, at the cost of needing someone to configure it correctly.
WordPress.org's own performance guidance treats hosting, caching, and content offloading as the three pillars of a fast site, ahead of any plugin tweak.
Layer your caching correctly and each piece does a distinct job: page caching serves a fully rendered HTML file instead of rebuilding it on every visit, object caching (Redis or Memcached) stores repeated database query results in memory instead of hitting MySQL again, OPcache stores compiled PHP bytecode so the server doesn't reparse your code on every request, and a CDN serves static assets from a server geographically close to the visitor.
Caching plugins alone rarely fix a server- or database-level problem. Server-level caching like Nginx FastCGI paired with Redis object caching consistently outperforms PHP-only plugin caching under repeated load, because it skips the PHP execution entirely on cache hits.
Fixing LCP and Render-Blocking Front-End Assets
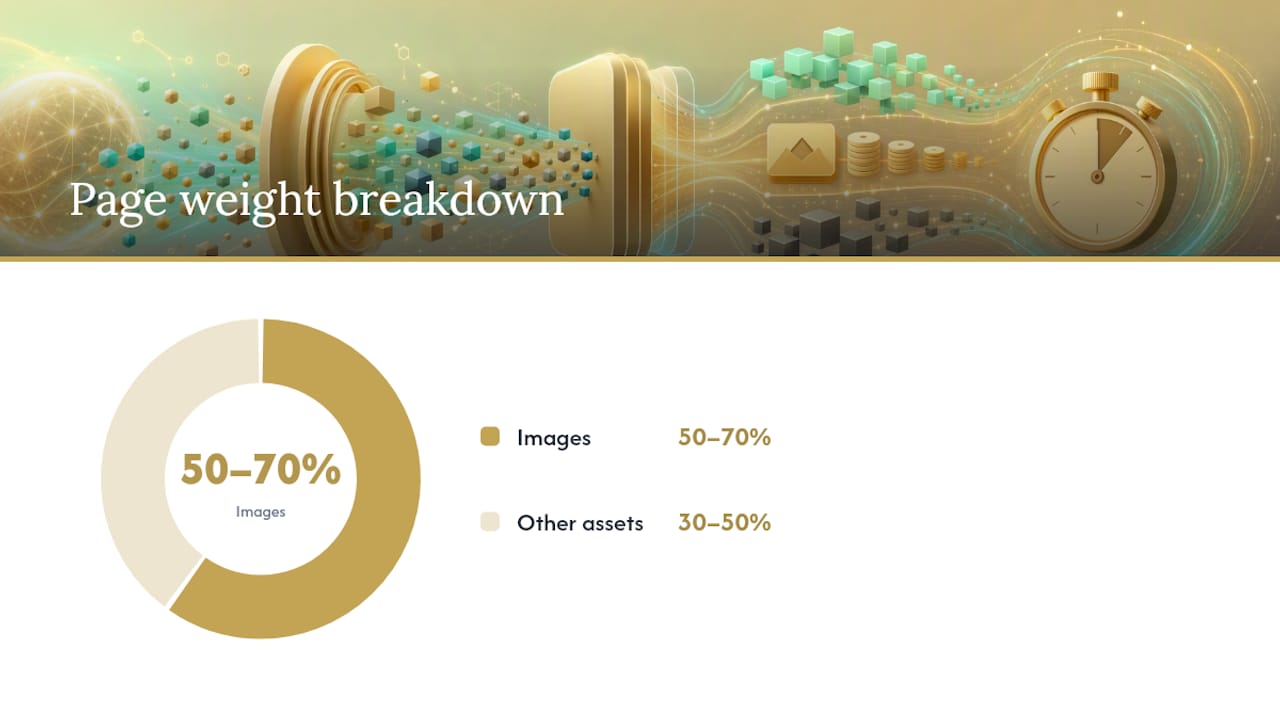
Once your backend responds quickly, the front end determines how fast the page actually feels to a visitor. Images alone often account for 50 to 70 percent of total page weight, which makes your image pipeline the single highest-leverage front-end fix.
- Convert images to WebP or AVIF; both cut file size dramatically over JPEG or PNG at equal visual quality.
- Build a responsive
srcsetso mobile visitors aren't downloading a desktop-sized hero image. - Always set explicit width and height attributes to prevent layout shift while images load.
- Preload your LCP image with
fetchpriority="high"so the browser prioritizes it over less critical assets.
CSS and JavaScript need the same triage. Inline only the critical CSS needed to render above-the-fold content, and defer everything else. Delay noncritical and third-party scripts (chat widgets, analytics, ad tags) until first user interaction rather than loading them on initial page load; those third-party calls are a frequent, invisible drag on both LCP and interaction responsiveness.
Fonts deserve their own pass: subset to only the characters you need, limit yourself to one or two font families, and use font-display: swap so text renders in a fallback font instead of staying invisible while the custom font downloads.
Pro Tip: Run your homepage through Chrome DevTools' Lighthouse panel after each change, not just at the end. Isolating which fix actually moved the needle saves you from undoing something that was helping.
How Database Bloat and Autoloaded Options Slow Every Page
Every page load on WordPress queries wp_options, and any row marked autoload = 'yes' gets pulled into memory on that request whether the page needs it or not. Years of plugin installs and abandoned settings can leave that table carrying megabytes of dead weight, and it slows down both your admin dashboard and your public-facing pages.
Find the offenders with a direct query:
SELECT option_name, LENGTH(option_value) AS size
FROM wp_options WHERE autoload='yes'
ORDER BY size DESC LIMIT 20;
- Review the results for oversized rows tied to plugins you no longer use.
- Delete expired transients; they frequently sit unautoloaded for months.
- Cap post revisions (five is plenty for most sites) and clean orphaned postmeta left behind by deleted plugins.
- Schedule this cleanup quarterly rather than treating it as a one-time fix.
Autoloaded options are one of the most overlooked causes of a slow backend. A bloated
wp_optionstable can add real, measurable delay to every single request, admin and frontend alike, and most site owners never think to check it.
Once the table is trimmed, adding Redis object caching prevents the same expensive queries from hitting MySQL repeatedly, which compounds the improvement rather than just delivering it once.
Cron Jobs and External Calls That Quietly Slow Every Page
WordPress's default wp_cron runs on every page visit, checking whether scheduled tasks are due. On a busy site, that check adds real overhead to requests that have nothing to do with the task itself.
- Disable
wp_cron's default trigger and run it as a real system cron job instead, so it fires on a schedule rather than piggybacking on visitor traffic. - Use Query Monitor's HTTP API panel to spot blocking external calls, like a payment gateway check or a third-party API lookup, and move anything nonessential to a background task.
- Reduce the Heartbeat API's frequency or disable it on the front end entirely; it polls the server every 15 to 60 seconds by default and adds unnecessary admin-side load.
Your Priority Action Plan for a Faster WordPress Site
Fix in this order, and verify each step before moving to the next.
- Immediate: Measure TTFB, turn on page caching and a CDN, and preload your LCP image.
- Next: Run the plugin audit, rebuild your image pipeline, test a PHP upgrade to 8.2+ on staging, and enable object caching.
- Advanced: Tune server-level caching (Nginx FastCGI), clean and reindex the database, and restructure how heavy plugins load their assets.
| Stage | Primary metric to check | Target improvement |
|---|---|---|
| Immediate | TTFB | Drop into the 200 to 300ms range |
| Next | LCP, plugin query count | Meaningful drop in Lighthouse performance score |
| Advanced | Full Lighthouse audit | Consistent 90+ score across page types |
Upgrading to PHP 8.2 or newer on staging first is consistently one of the highest-return, lowest-effort moves available, provided your theme and plugins are compatible.
What Actually Slows Down Most WordPress Sites
The mistake I see most often isn't a bad plugin or cheap hosting on its own. It's skipping measurement entirely and jumping straight to fixes based on a hunch. Site owners install a caching plugin, see no change, and conclude WordPress is just slow by nature. It usually isn't. It's TTFB nobody measured, or a wp_options table nobody audited.
Quick wins, like enabling a CDN or preloading an LCP image, take hours. Structural fixes, like a PHP upgrade or a full plugin audit on staging, take days to weeks depending on how much access you have to the server. If you don't have that access, or you're running a complex WooCommerce setup, that's usually where it makes sense to bring in outside help. Some web design companies build hand-coded, performance-first sites for service businesses, and recommend starting every project with this kind of measurement, not guesswork.
— Elijah
When It's Time to Hand Off Your Speed Audit
If you don't have server access, you're running a complex WooCommerce or membership setup, or you simply don't have the hours to work through a plugin audit and database cleanup properly, that's the point where a done-for-you fix outperforms another weekend of trial and error. Kirk & Co Software handles full performance audits, hosting migrations, server tuning, and ongoing website maintenance and support for local businesses across Indiana, so you're not the one staring down a wp_options table at midnight.

For sites where the underlying build itself is fighting you, a performance optimization audit starts with the same backend-first diagnosis covered above, then fixes it at the source instead of layering another plugin on top. If your current site was never built for speed in the first place, it's worth reviewing what a custom-coded rebuild actually changes long term. Request a speed audit and get a straight answer on what's slowing your site down before you spend another dollar guessing.
Where to Go Deeper on WordPress Performance
For structural diagnosis, WordPress.org's own performance optimization guidance covers hosting, caching, and content offloading in more depth than most third-party guides attempt.
- Start backend-first with the diagnostic framework if you haven't measured TTFB yet.
- Move to the ultimate speed guide once your server side is solid and you're ready for front-end and asset-level tuning.
- Use the practical triage checklist as a running reference while you work through each stage.
Sources
- How to improve performance on WordPress — WordPress Developer Resources
- Finding what makes WordPress slow: diagnostic framework — MakeWPFast
- Why Is WordPress So Slow? Causes & Fixes — PageSpeed Matters